StockCharts.com Adds Fundamentals, Earnings Data and Corporate Information With New Equity Research Tool, 'Symbol Summary'

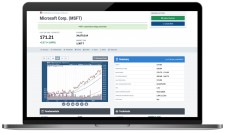
REDMOND, Wash., February 13, 2020 (Newswire.com) - StockCharts.com has announced the addition of fundamentals, earnings data and corporate information to its extensive technical analysis platform with the release of a new equity research tool, "Symbol Summary". Designed to give online investors an extensive, holistic tool for analyzing securities on StockCharts.com, the resource is unique for its combination of technical and fundamental data, displayed together in a single, easy-to-use package.
Available for any security on StockCharts.com, Symbol Summary allows users to view full quote information for stocks, ETFs, mutual funds, indexes, and cryptocurrencies. From a single page, users can dissect technical stats, fundamentals, earnings, dividends and corporate info, see a chart of the security and take actions to save that symbol in their StockCharts account. Fully responsive and optimized for every screen size, users can access the tool from their desktop, laptop, tablet, smartphone or other web-enabled device.
"This is arguably one of the most important additions to StockCharts.com in the past decade," said Grayson Roze, VP of Operations at StockCharts.com. "We have already seen an outpouring of positive feedback, excited reviews and thankful comments from hundreds and hundreds of users, and that really validates the importance of this feature to the broader StockCharts toolkit. This is only the start of a significant data expansion on our platform, and we are thrilled to see this new initiative already off to such a fantastic start with Symbol Summary."
The introduction of Symbol Summary, which launched on Jan. 31, 2020, is the first phase of a larger data expansion for StockCharts.com, with more features expected to be announced in the following weeks and months. These include the addition of complete quarterly earnings history and estimates, the ability to set alerts based on earnings events, and charting capabilities for fundamental data like P/E ratio, EPS, and market cap. In the meantime, StockCharts is inviting users to try out the Symbol Summary feature for their favorite securities and report their experiences.
Symbol Summary is now available for both free users and paid subscribers. A detailed explanation of its features and capabilities can be found in the company's initial announcement article.
About StockCharts
StockCharts.com is the web's leading technical analysis and financial charting platform for online retail investors. Founded in 1999 by early Microsoft developer Chip Anderson, the company has been an industry leader in the financial technology space for nearly two decades, providing innovative, award-winning charting and analysis tools to a global audience.
By using technology to help investors visualize financial data, StockCharts.com allows users to better analyze the markets, monitor and manage their portfolios, find promising new stocks and funds to buy, and ultimately make smart, well-timed investment decisions. With over 1.5 million active monthly users and counting around the world, the company serves an ever-growing, ever-changing array of active traders and investors.
For press-related inquiries, please contact us at press@stockcharts.com.
Source: StockCharts.com